- Published on
6 Useful & Effective Analytical Gauges to Measure your Businesses Performance with Bepro
- Authors
- Name
- Sarah .M
What you can measure you can't grow. Data is the new age currency, it's what influences the world and what enables companies to grow exponentially.
Implementing an effective reporting and analytical system is something that should be rooted in a business before it's being watered. In this blog post we'll be going through teh analytical gauges Bepro provides from Projected & Confirmed Revenue, Popular Service, Individual Staff Performance, Average Client Net Sales, Client Visit Frequency and more.
Table of Contents
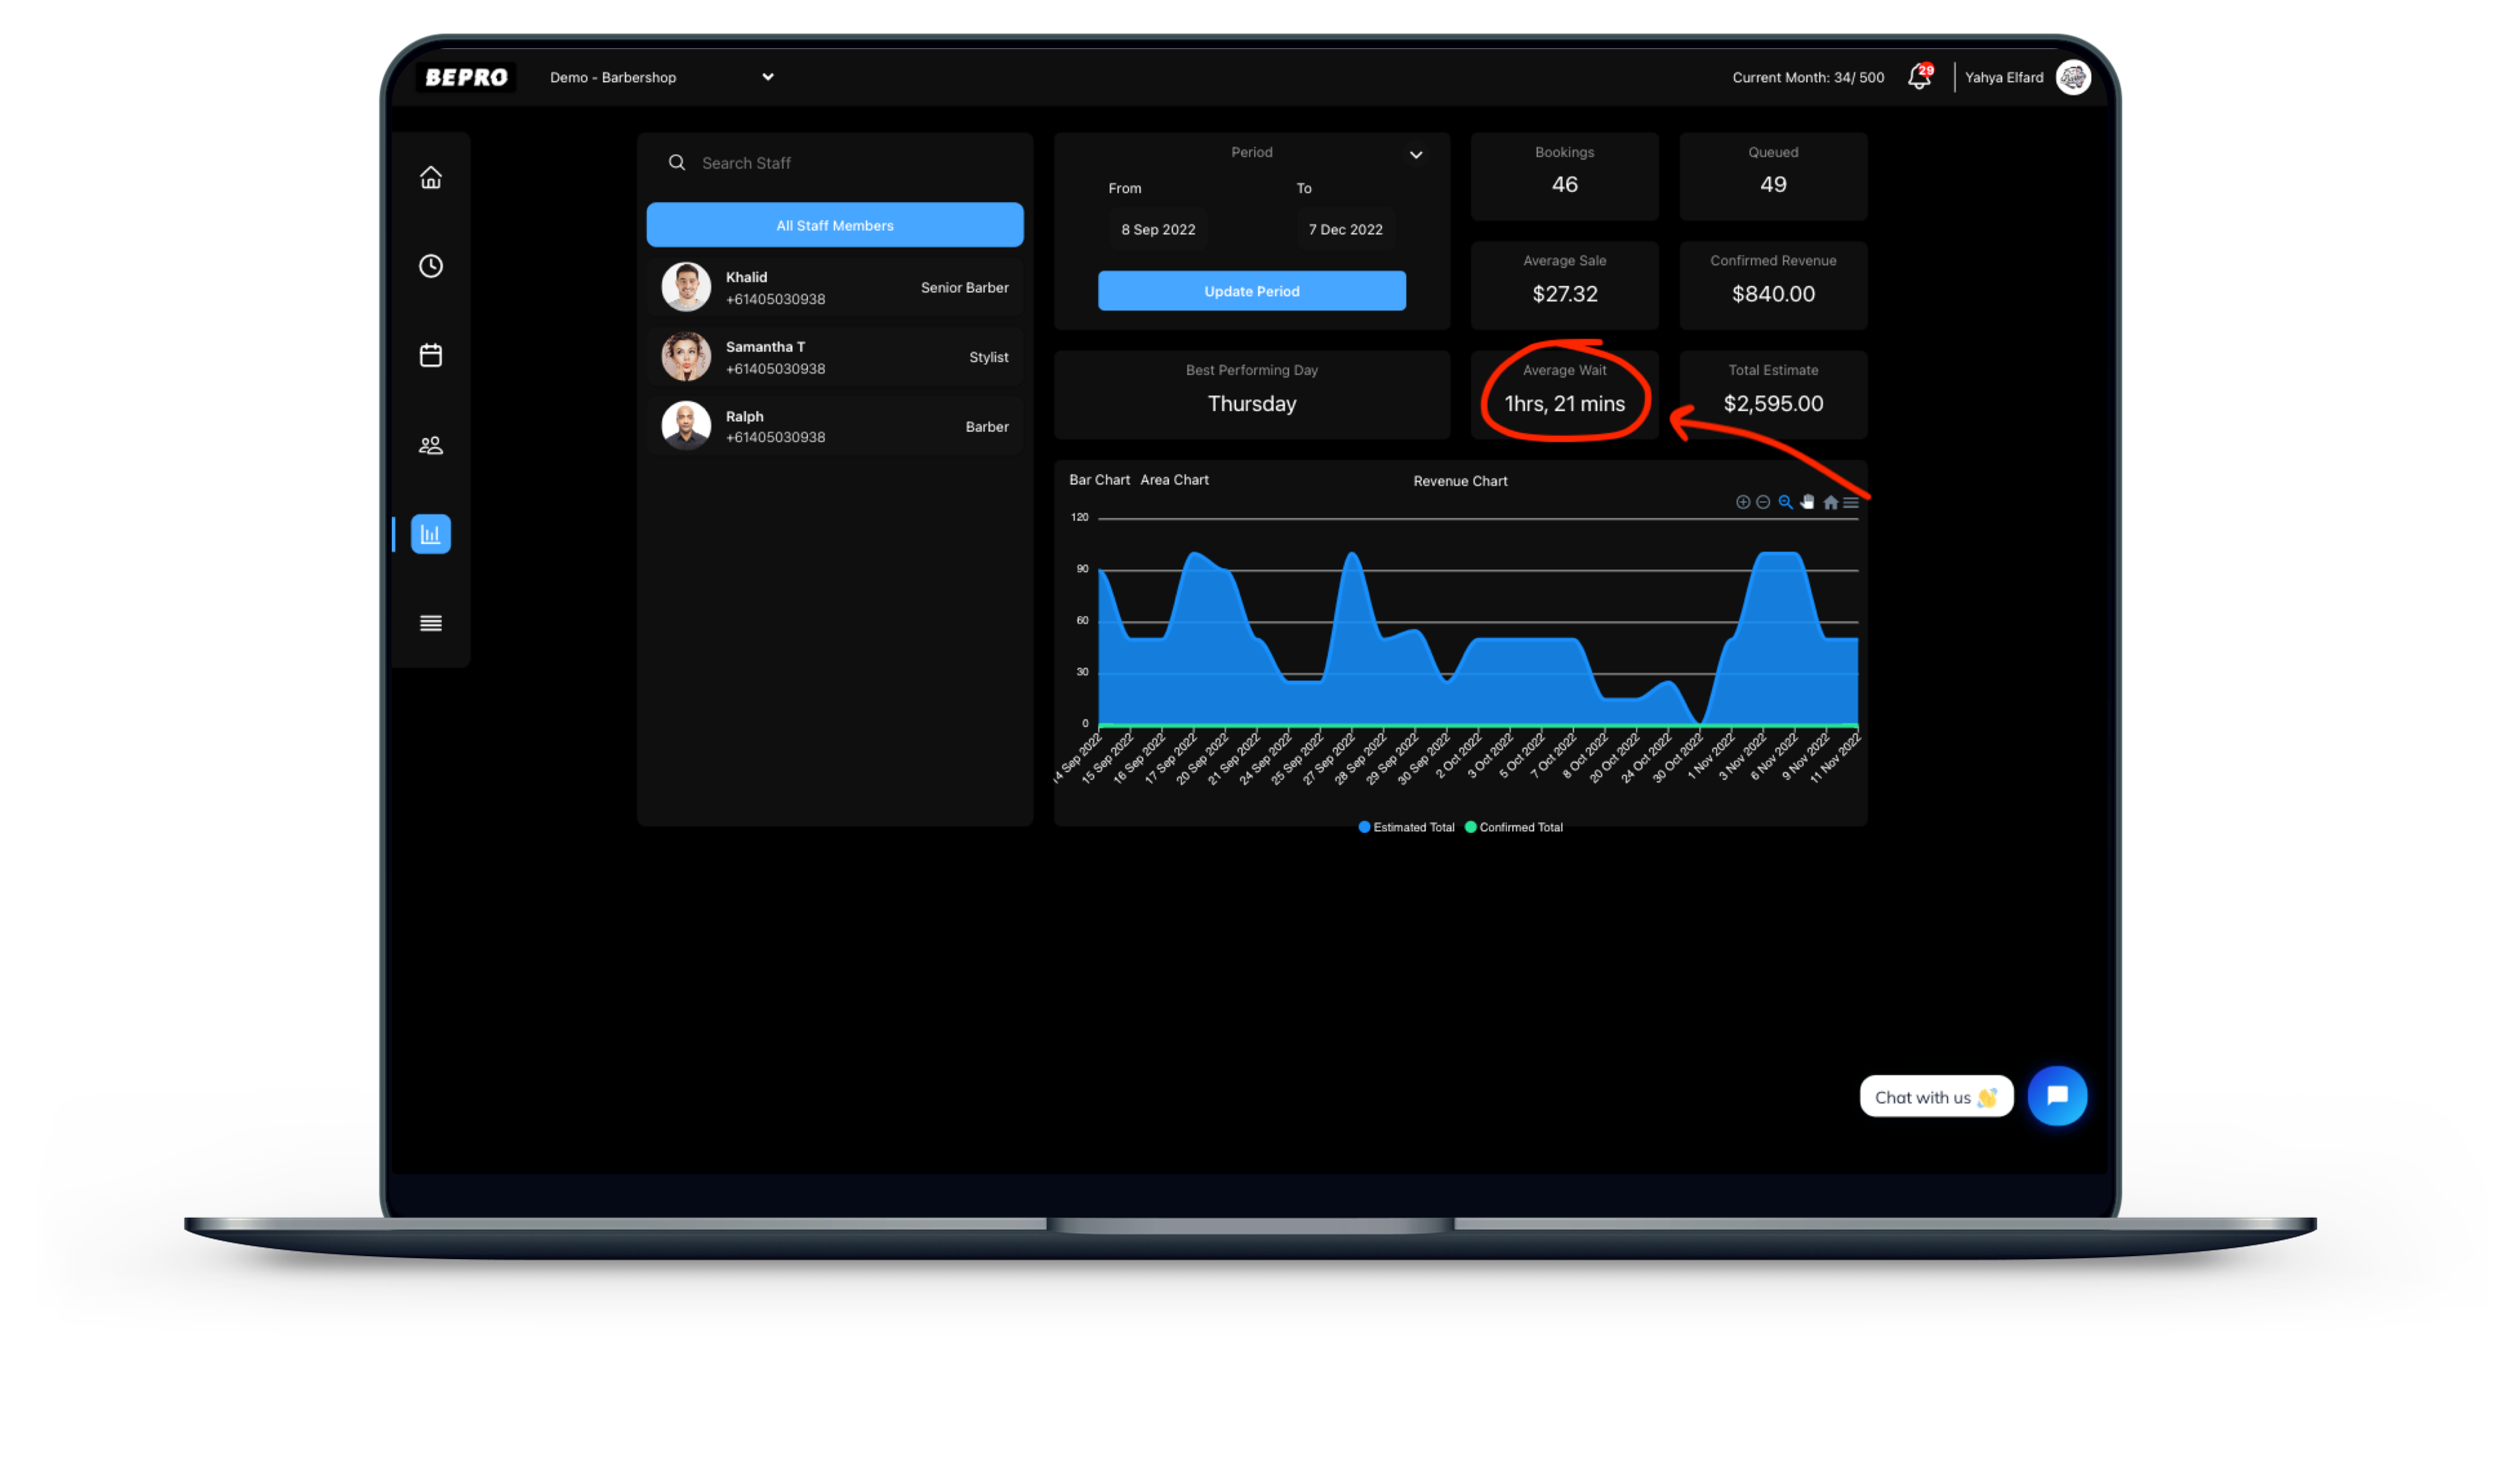
Average Wait Time
Taking into consideration your customers average wait time is crucial for growth. Knowing what days the average wait time is the highest will allow your business to be more effective in bringing more staff when needed.
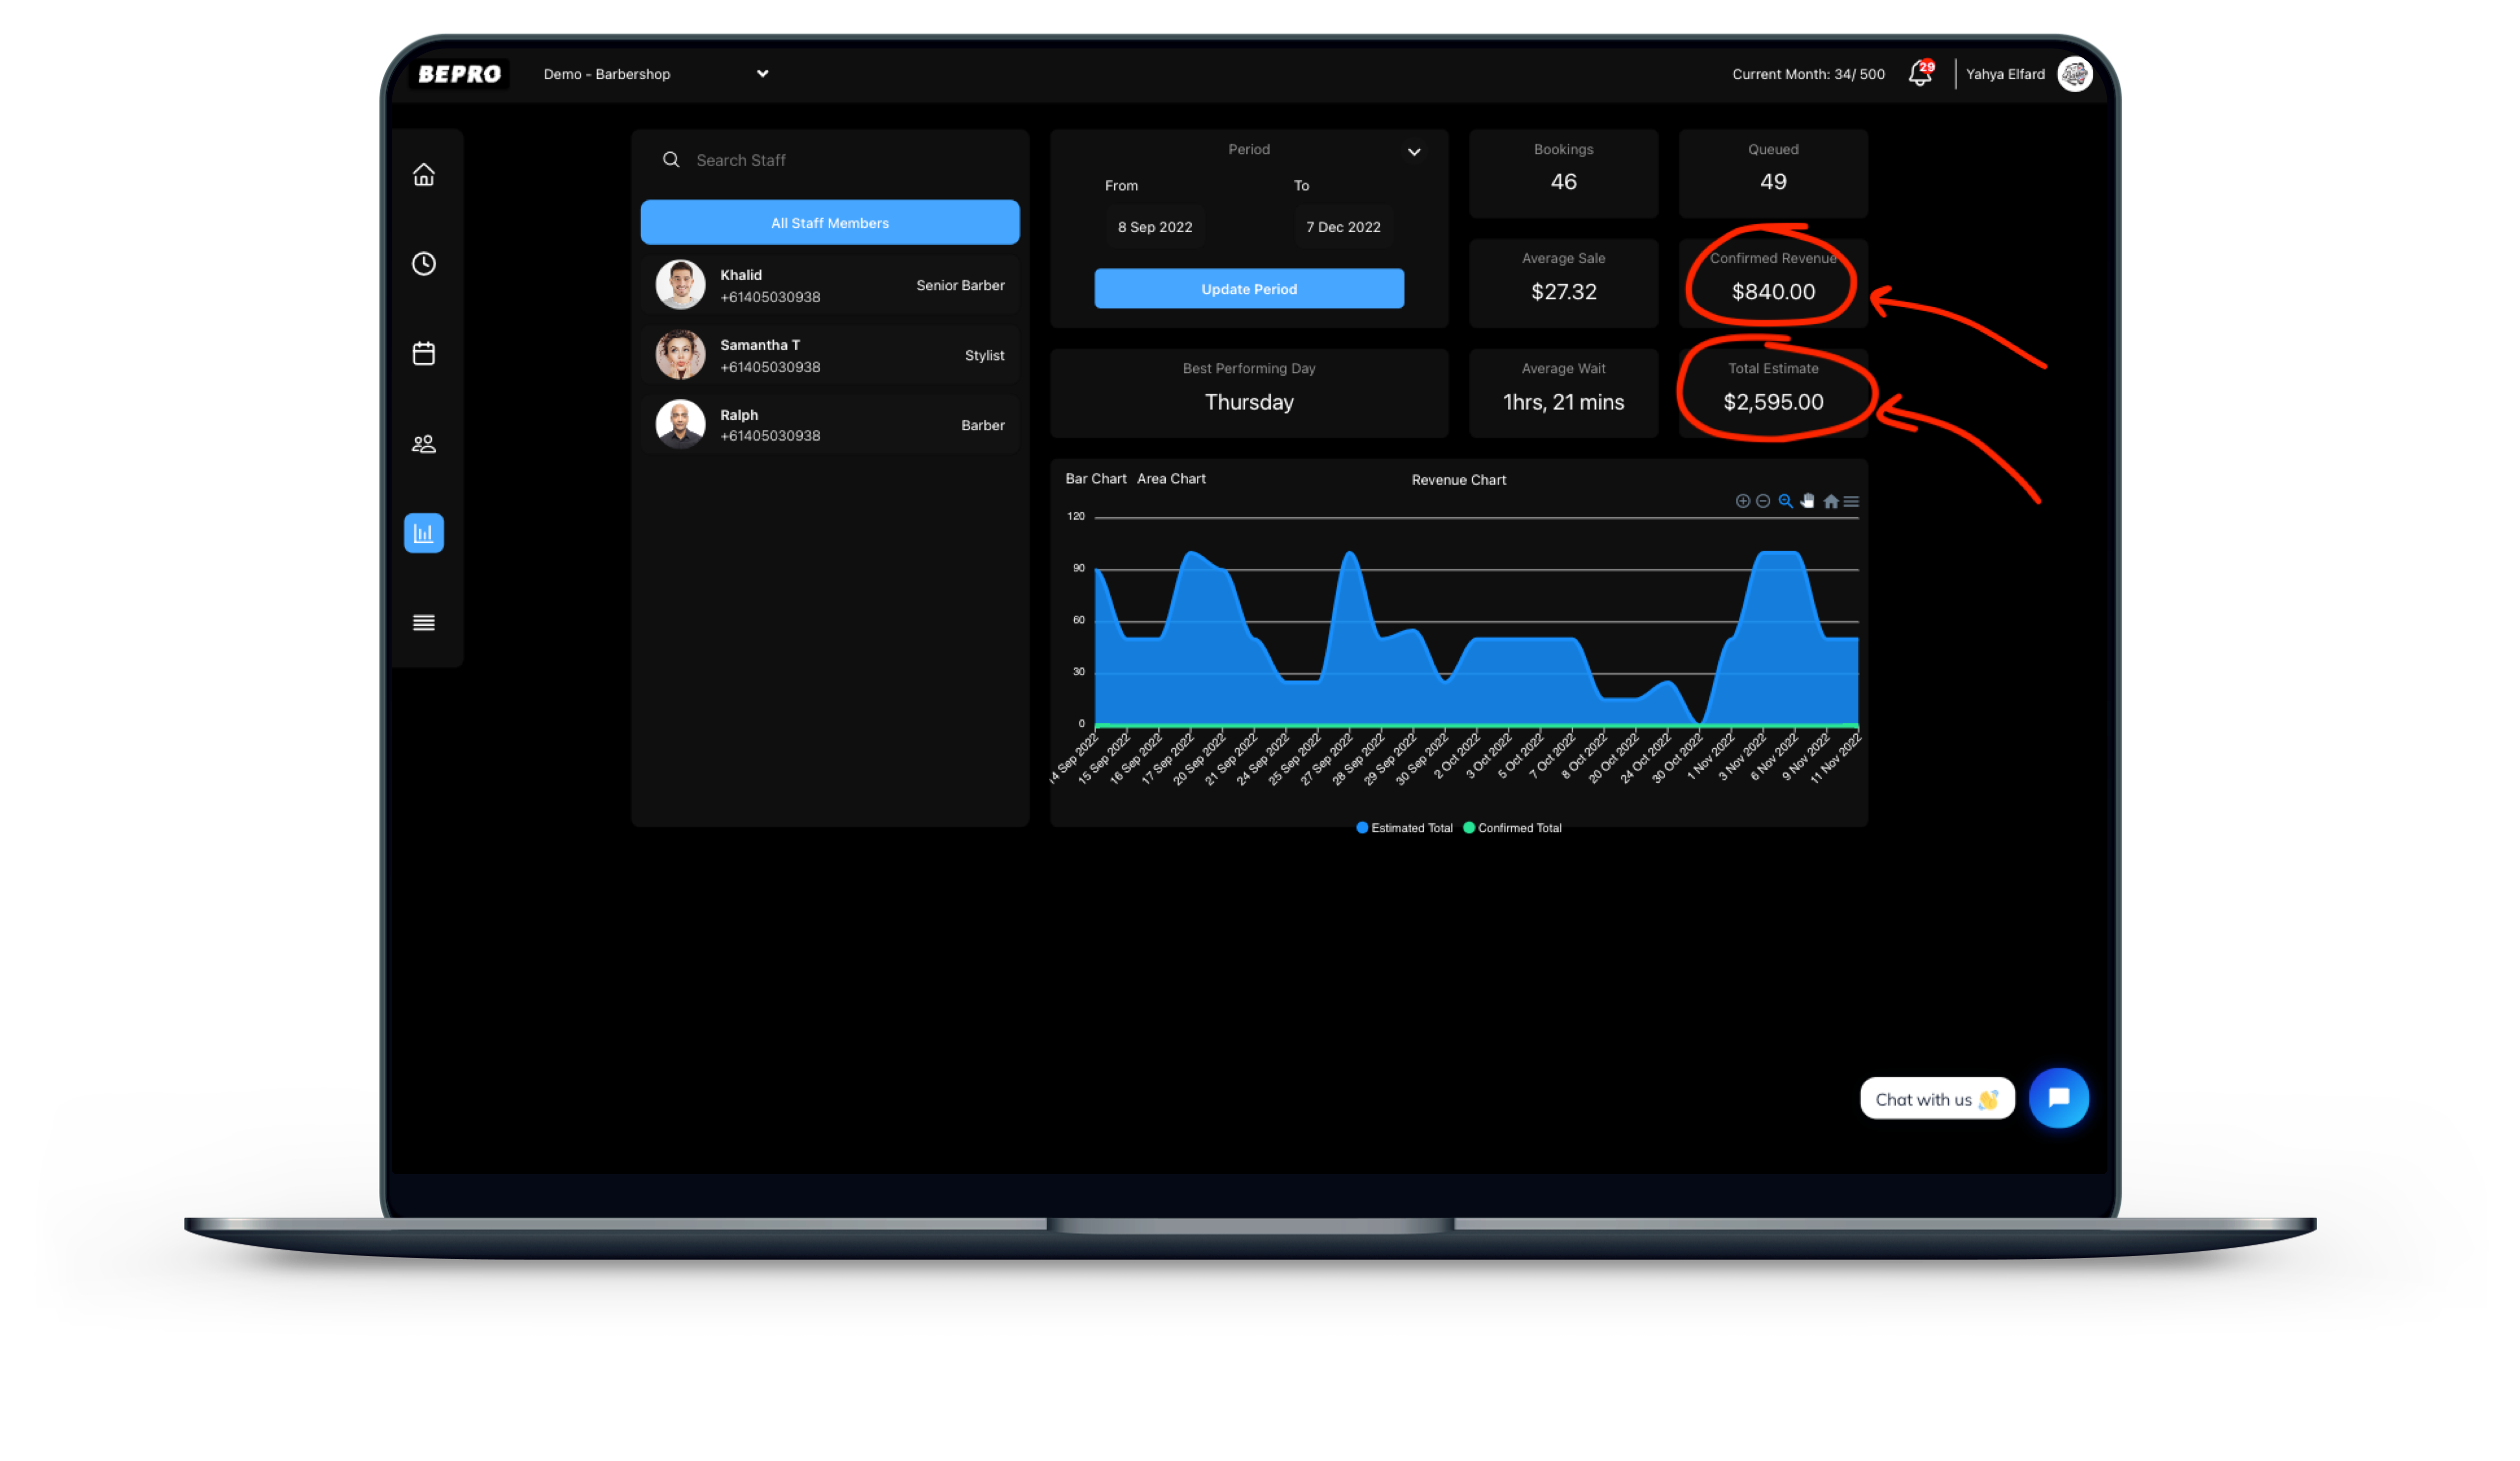
Projected & Confirmed Revenue
You can measure how many customers didn't show and how many customers actually paid for their services. This will keep your staff more accountable and on high alert in making sure customers pay after their services.
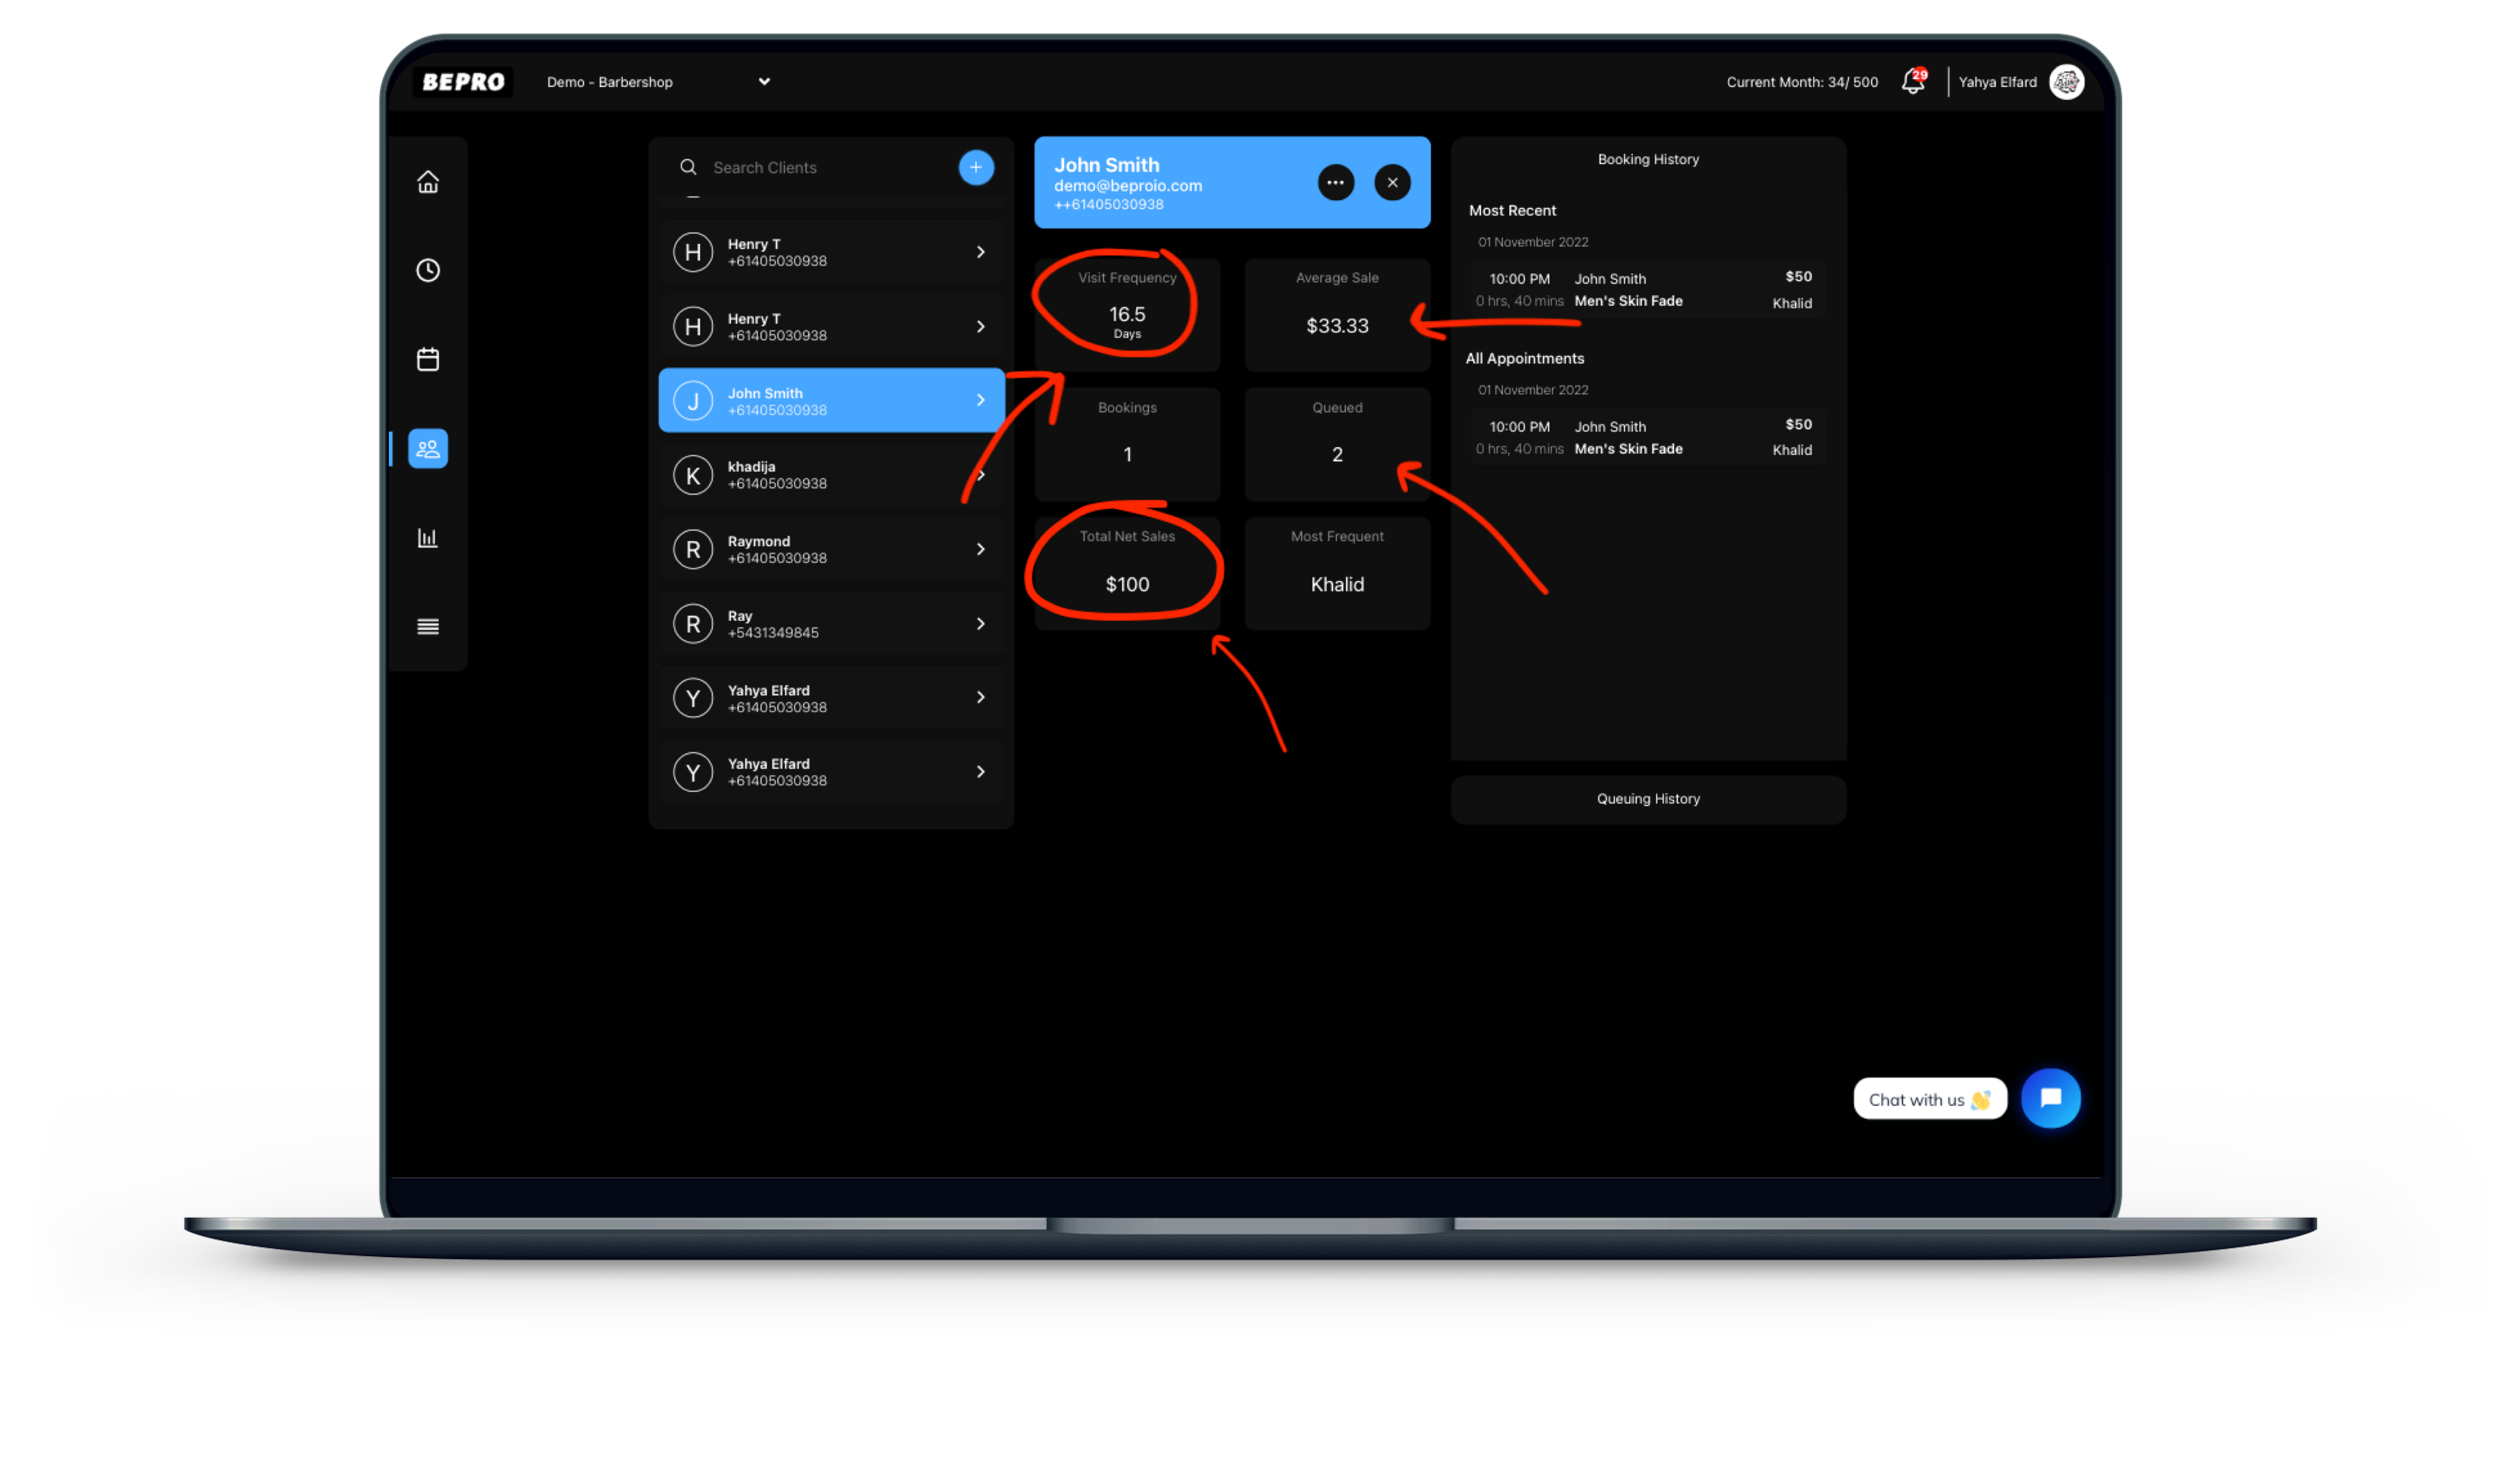
Customers Net Sales & Visit Frequency
Taking into consideration your customers average wait time is crucial for growth. Knowing what days the average wait time is the highest will allow your business to be more effective in bringing more staff when needed.
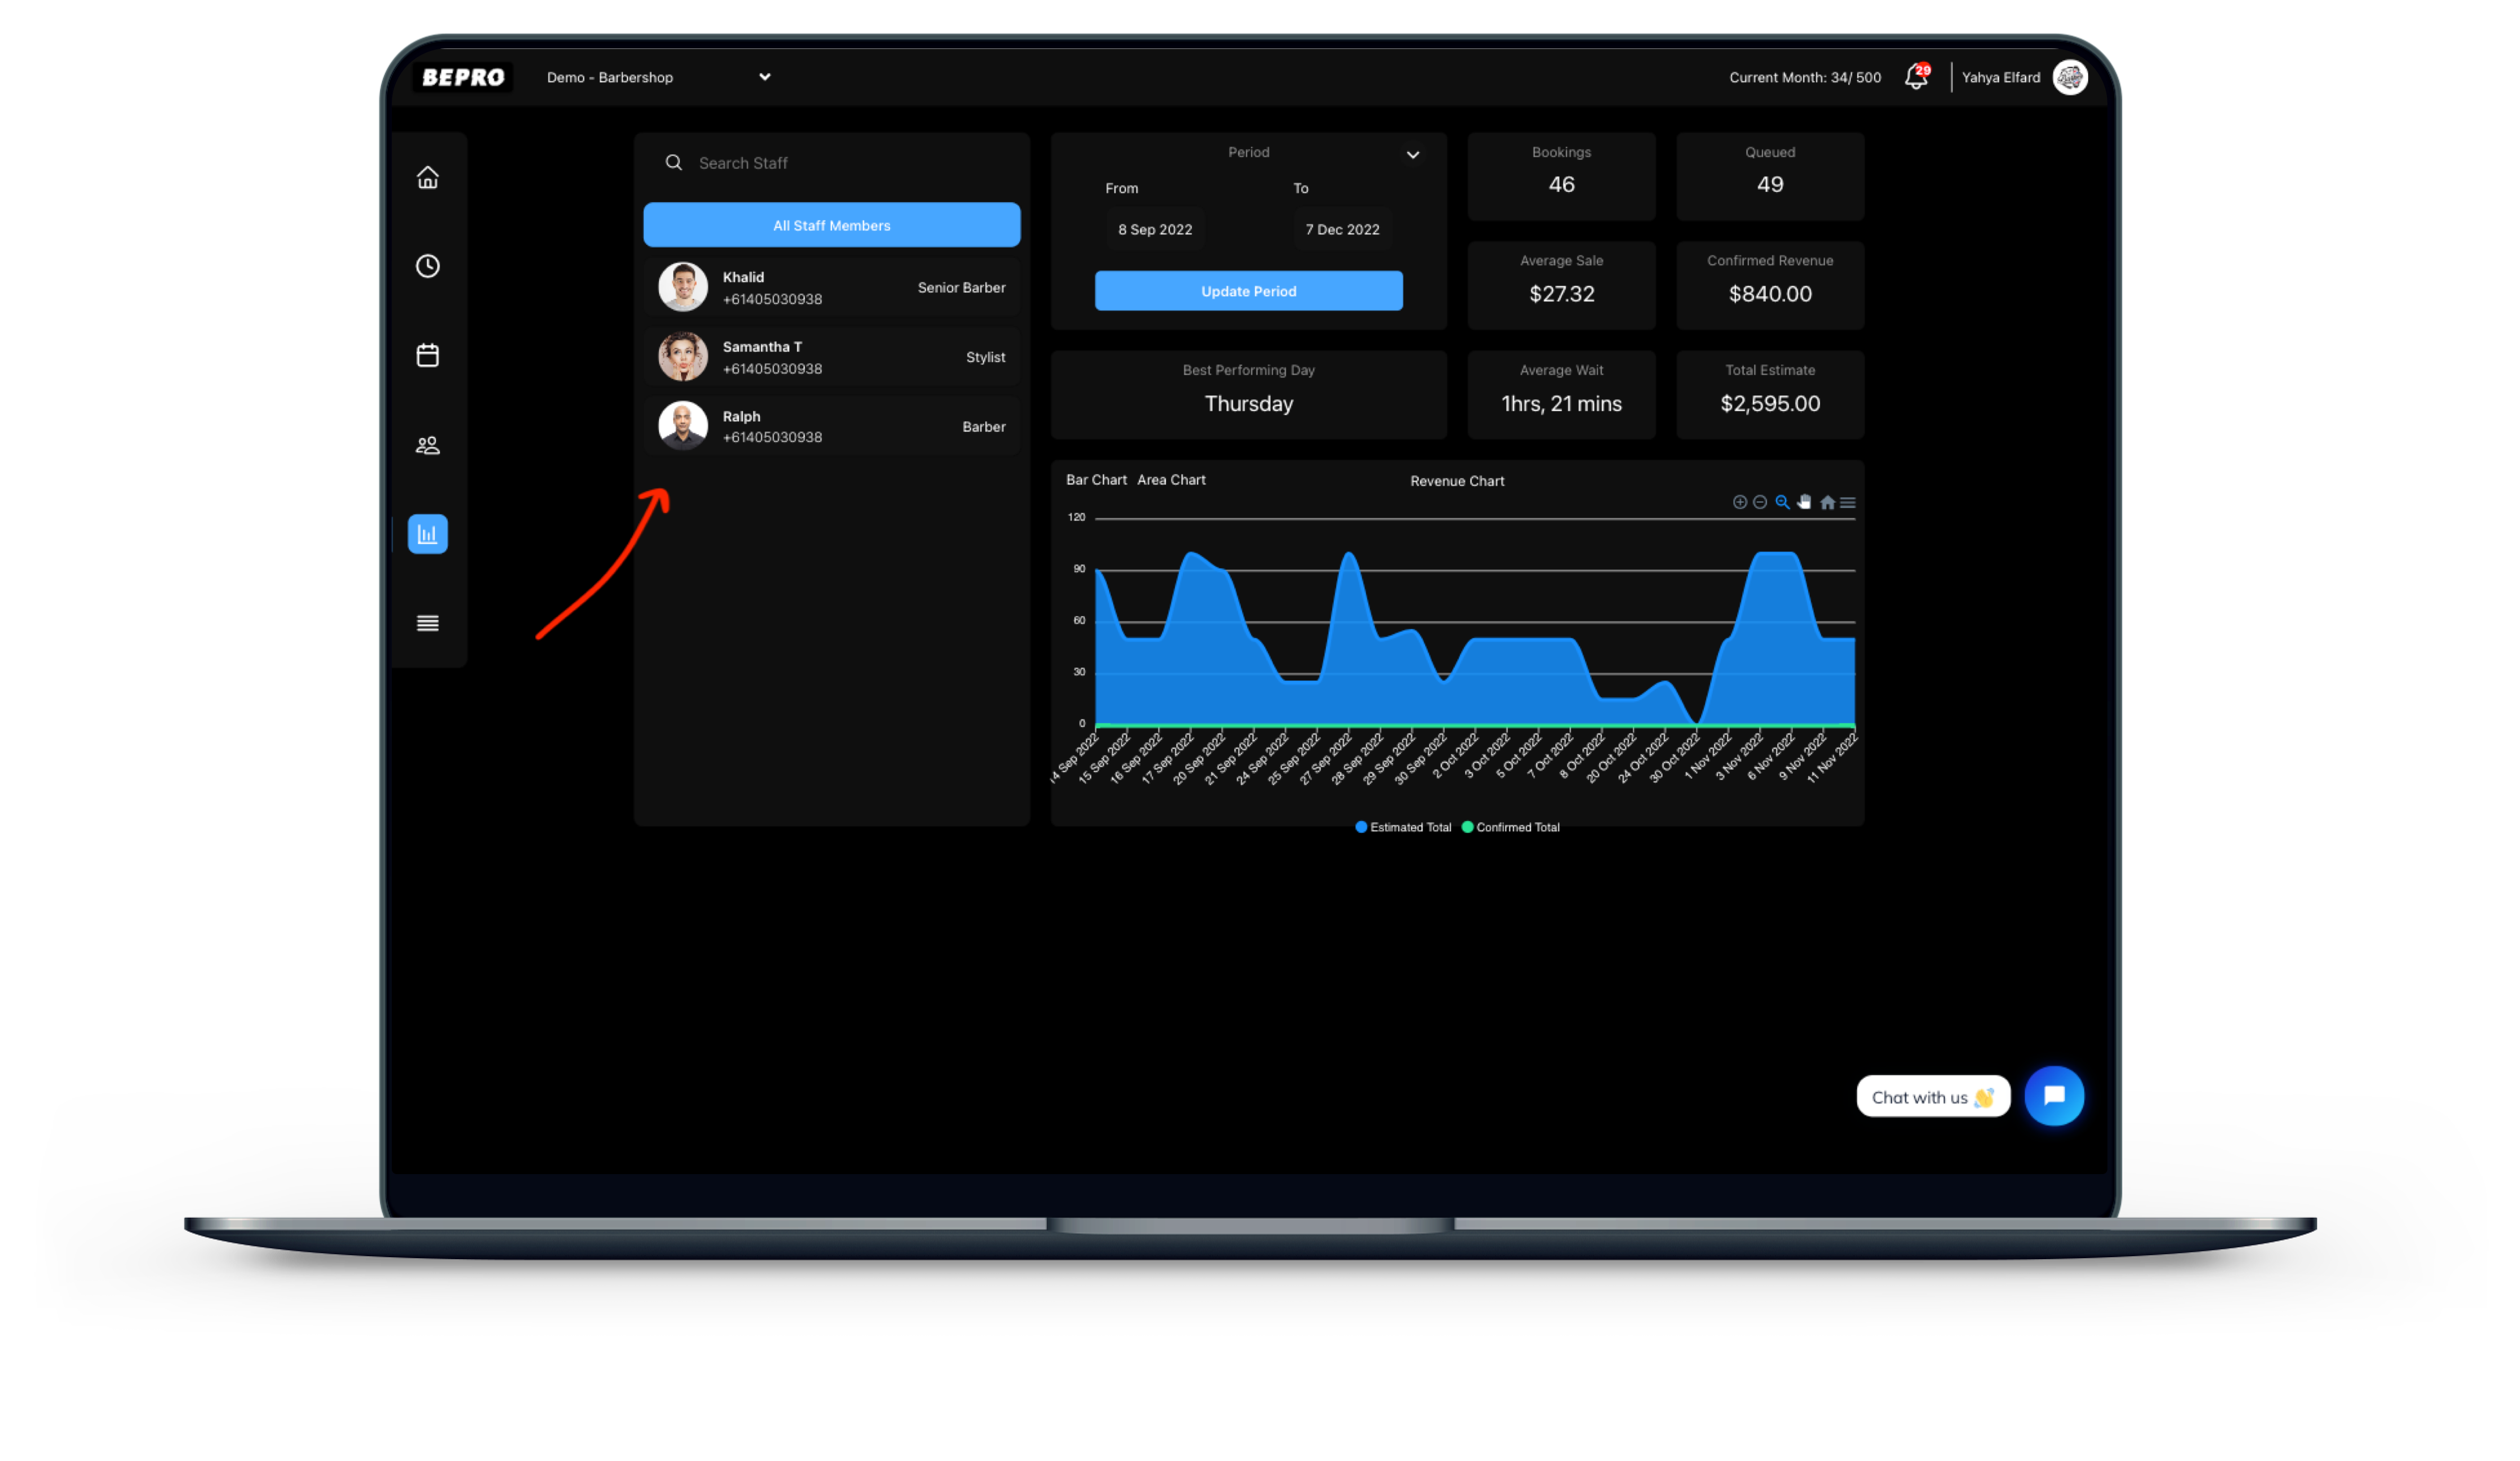
Individual Staff Performance
This one's my favourite, it allows you to keep track of your exponential members and what staff to help out more. You can track each staff members booking, queue, and revenue performance amongst other metrics.
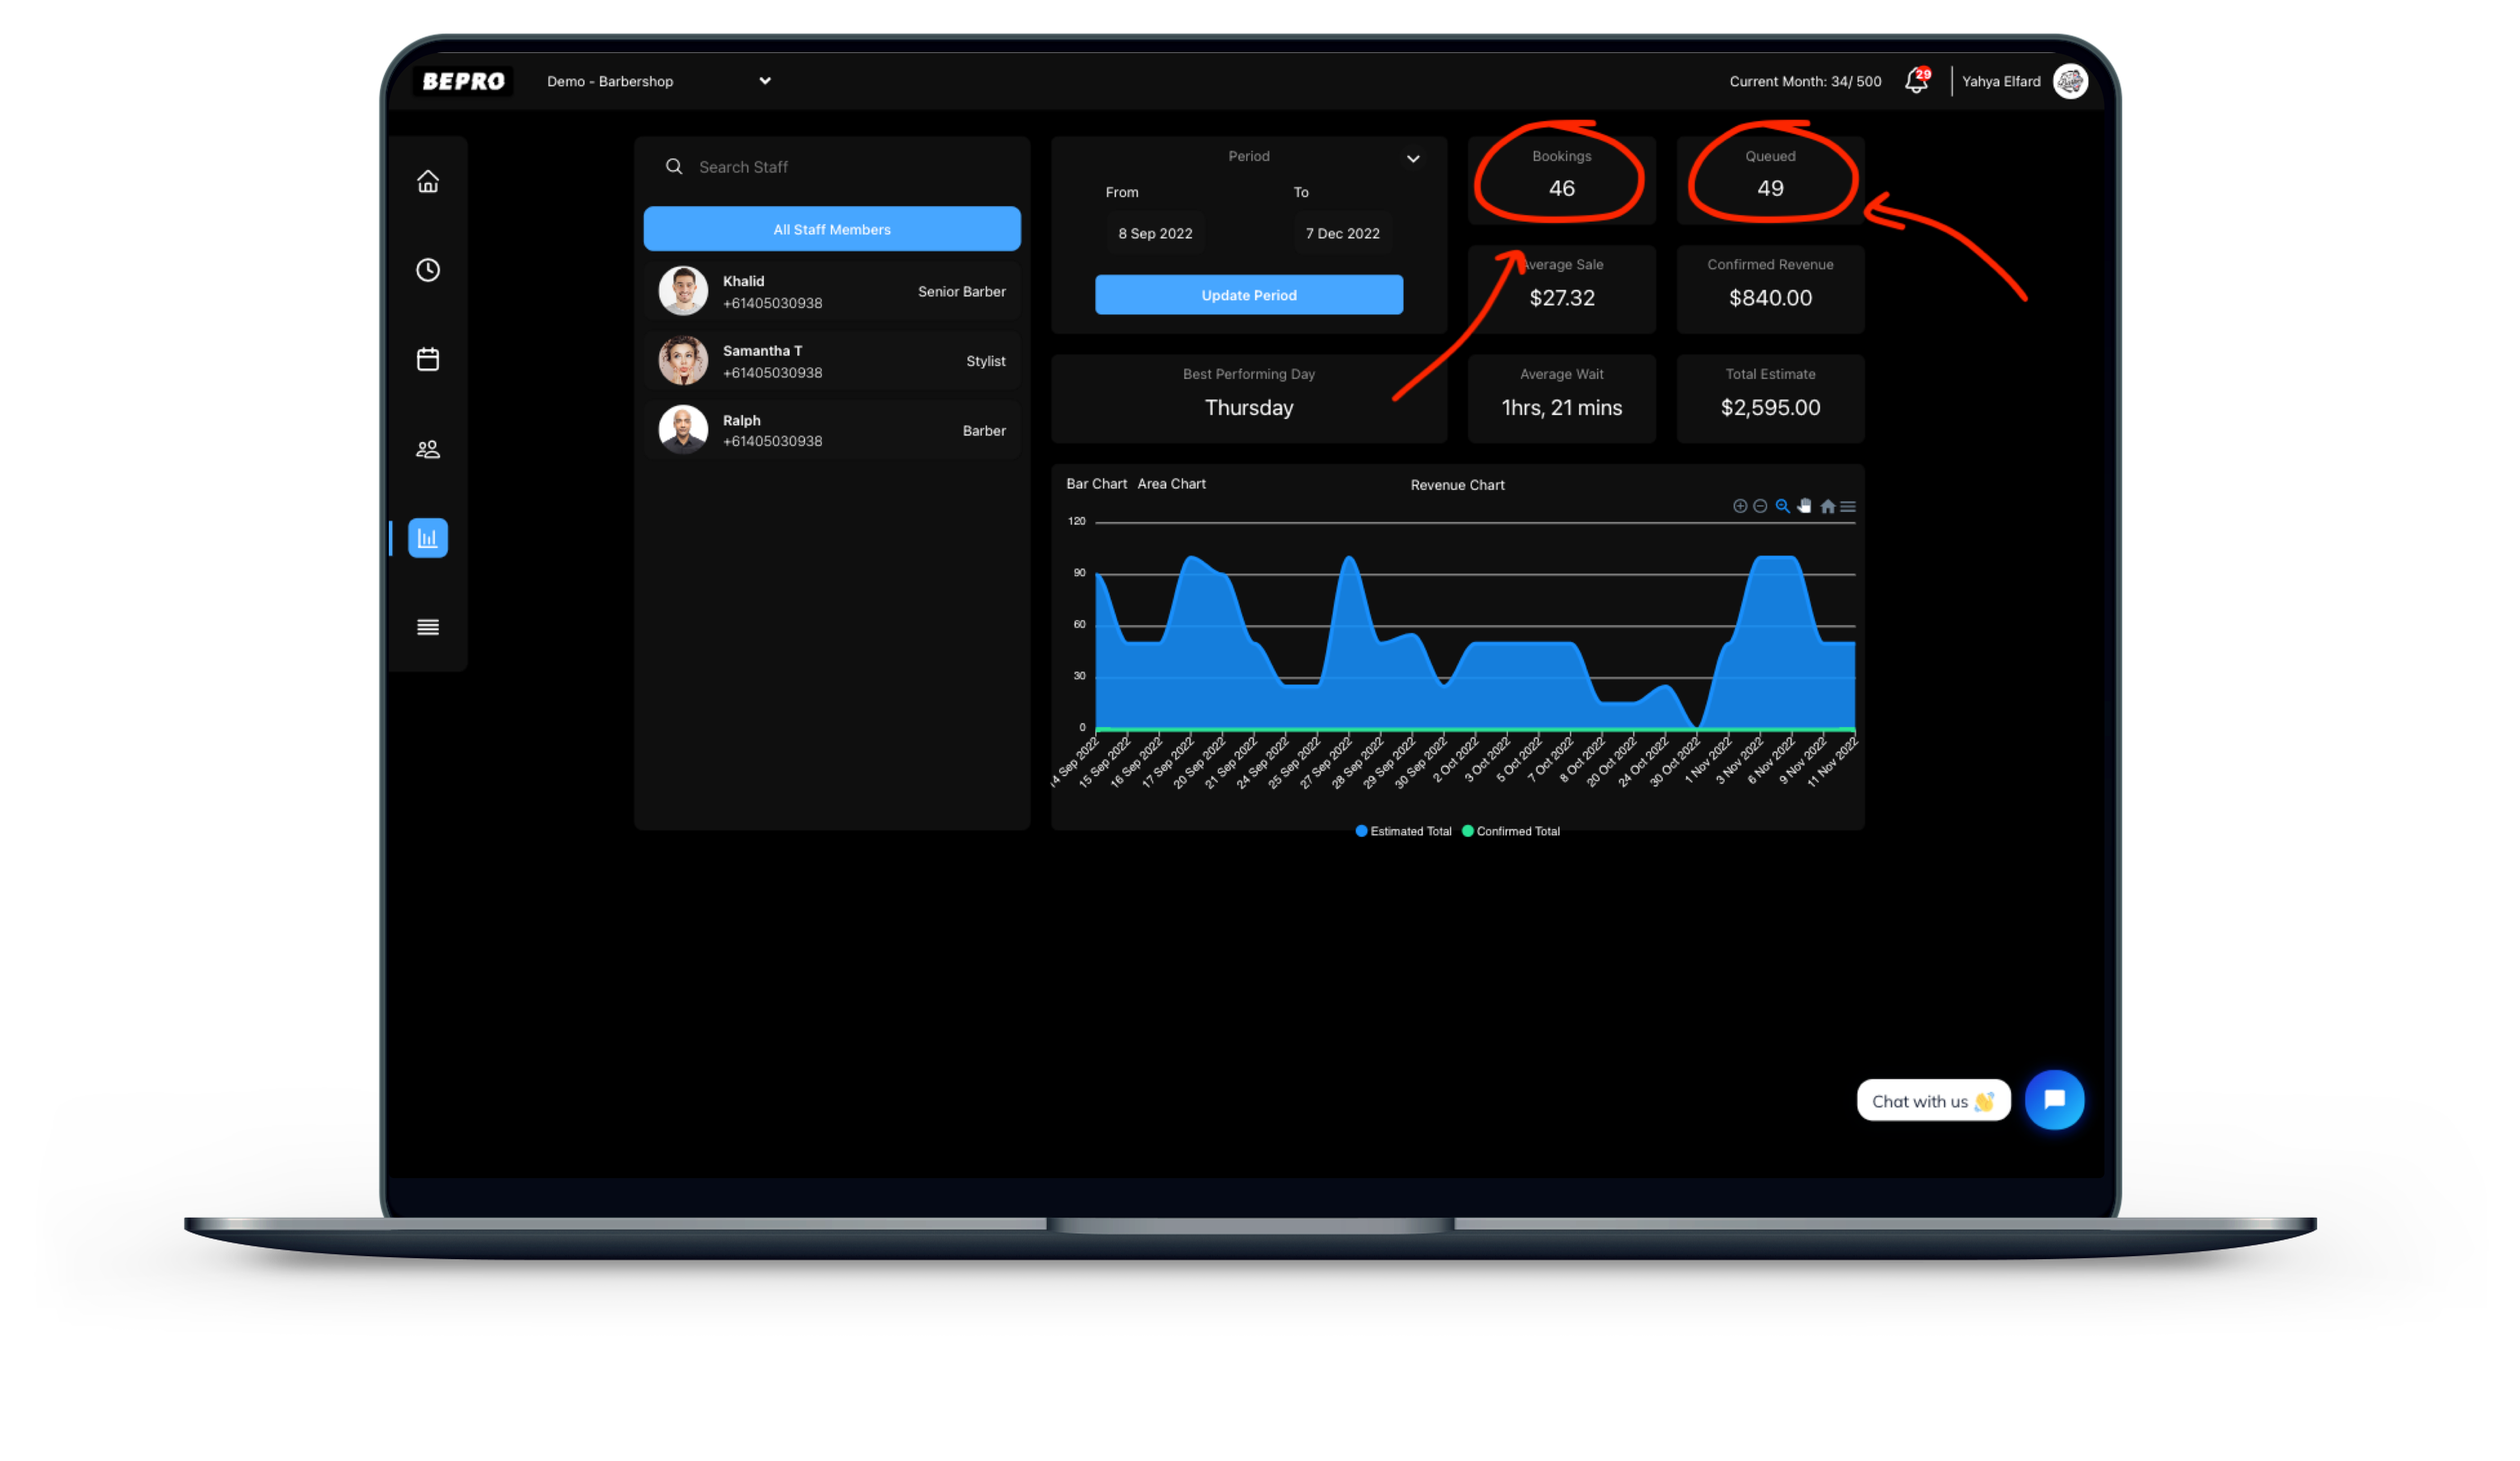
Overall from Queue and Bookings
Bepro also calculates your overall earning from queues and bookings from you. This save you and your business a lot of time as the data is collected and calculated for you in real time.
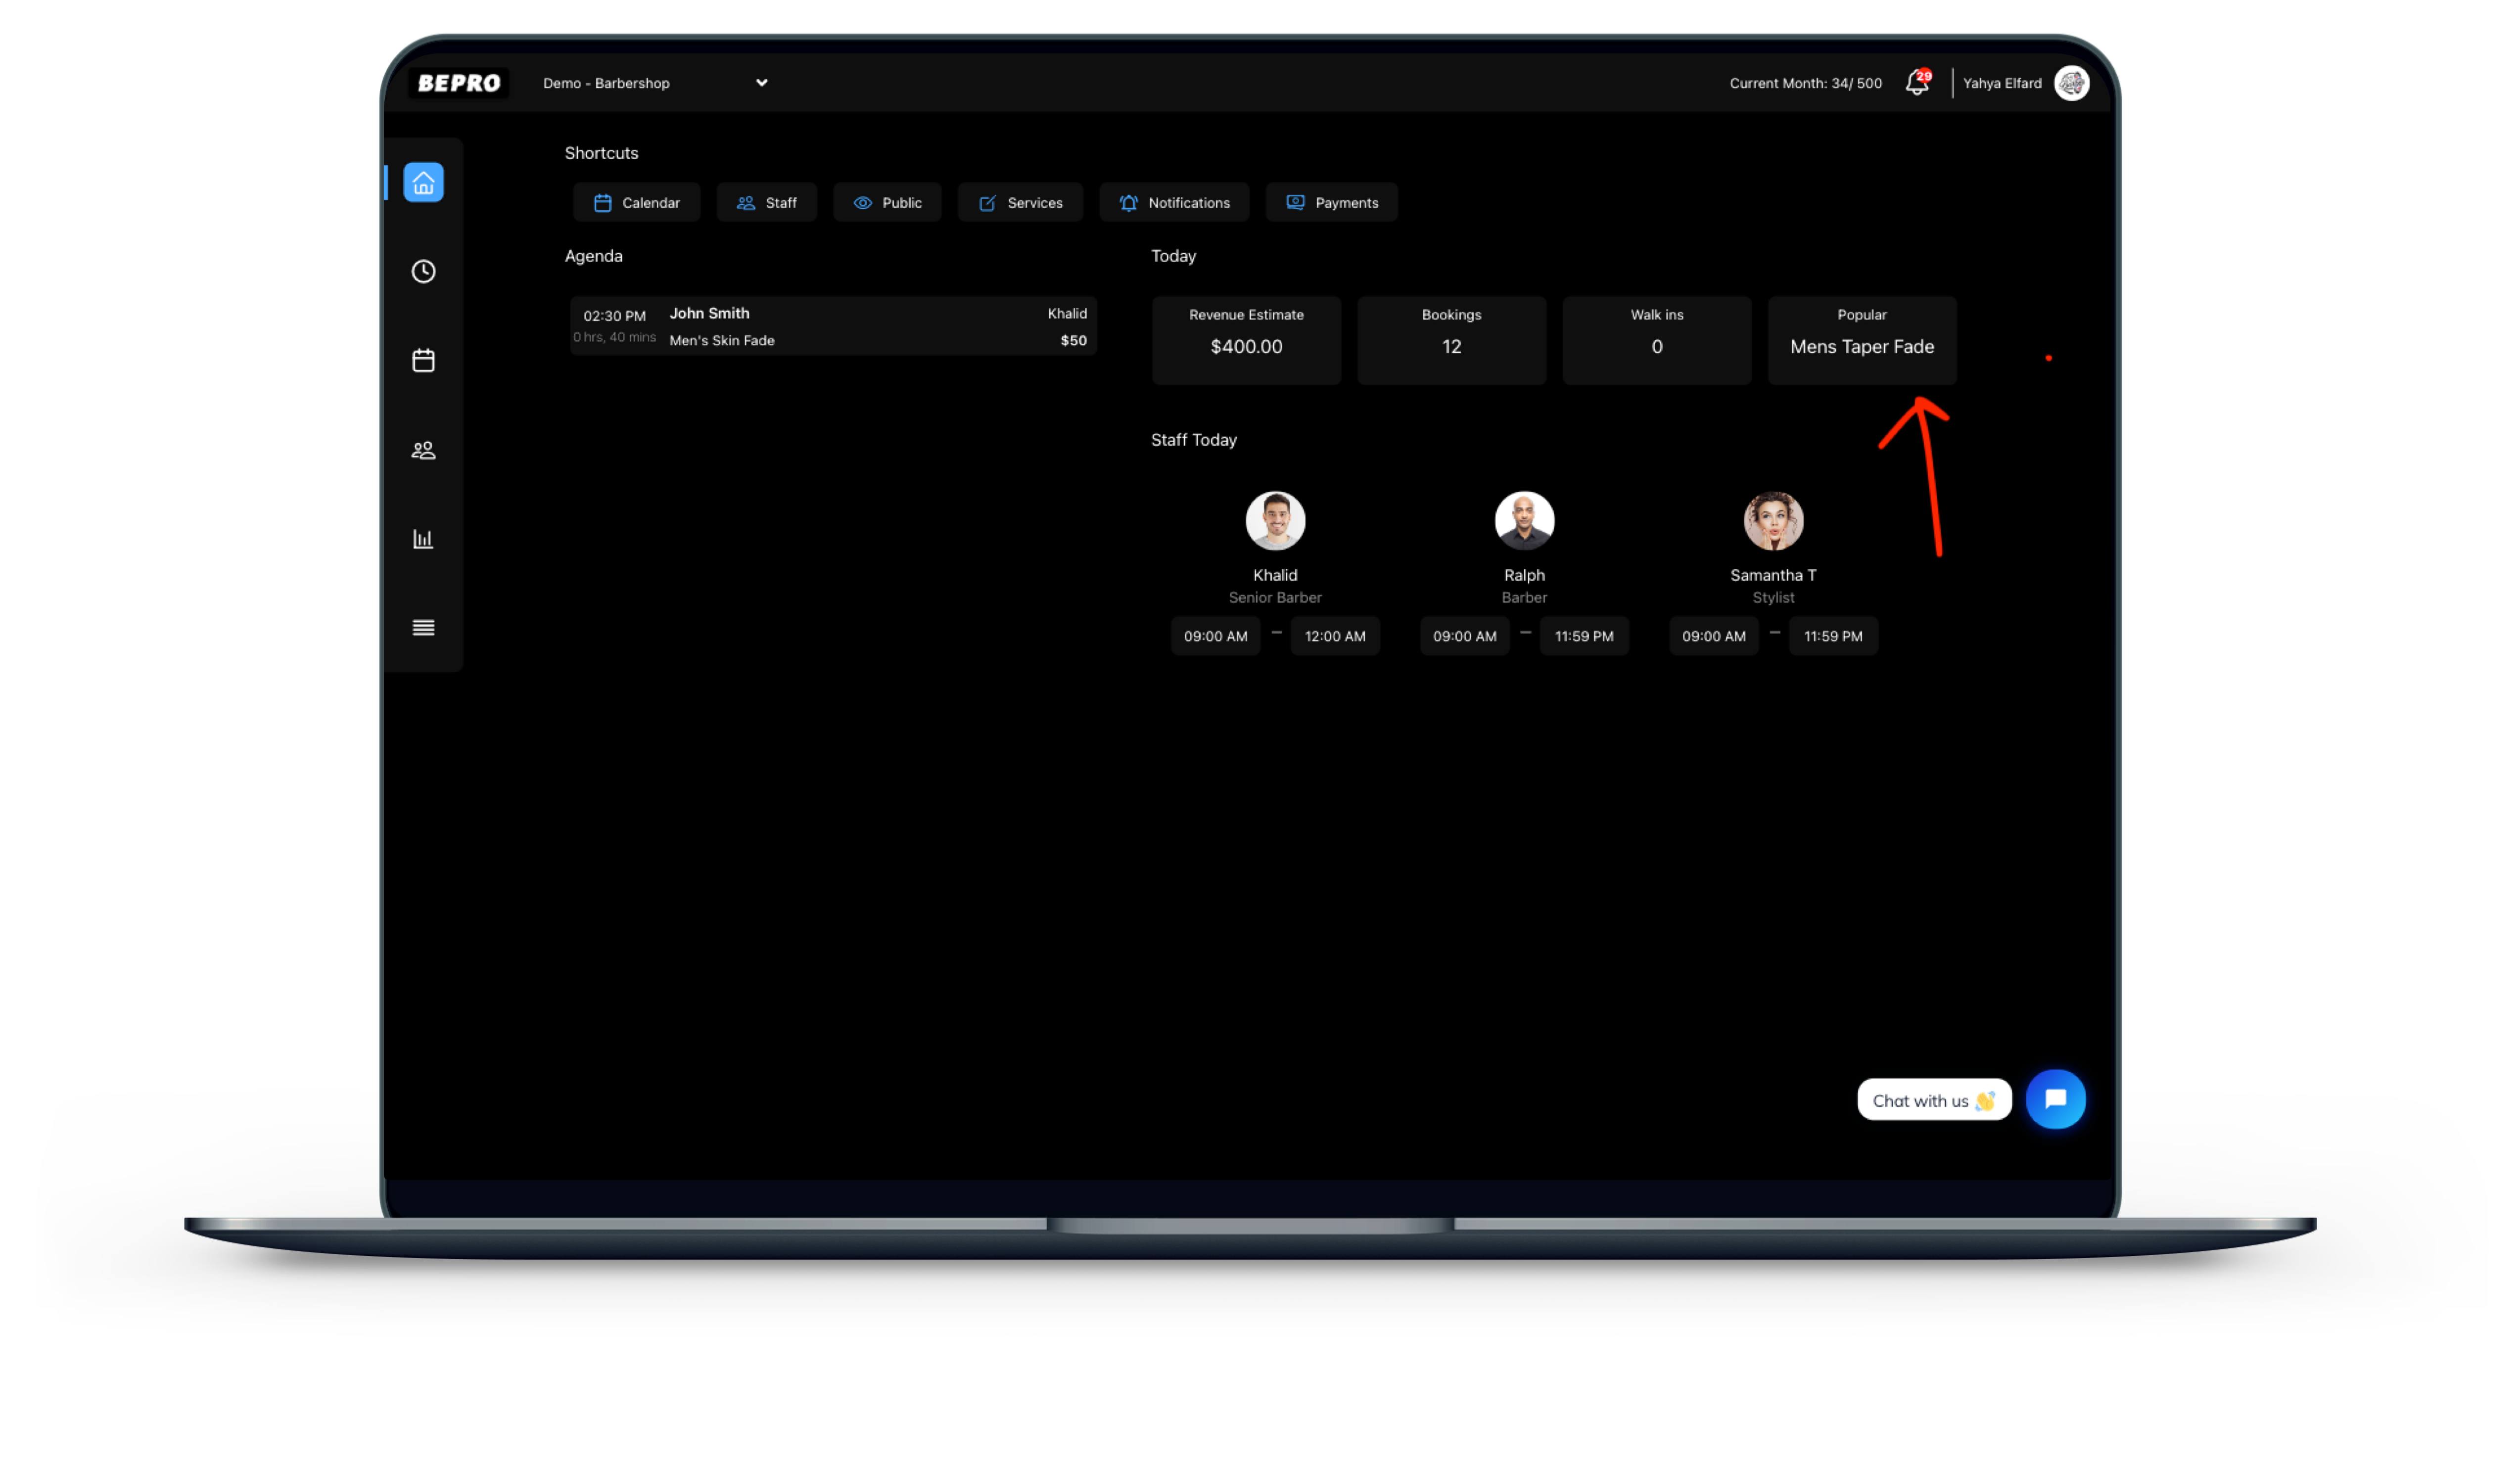
Popular Services
Yearly, quarterly, monthly, weekly or even daily, Bepro calculates your most popular service for a given period. Learning what clients pay for can allow you to make the necessary adjustments to grow exponentially.
Charts and Graphs for Visual Illustrations
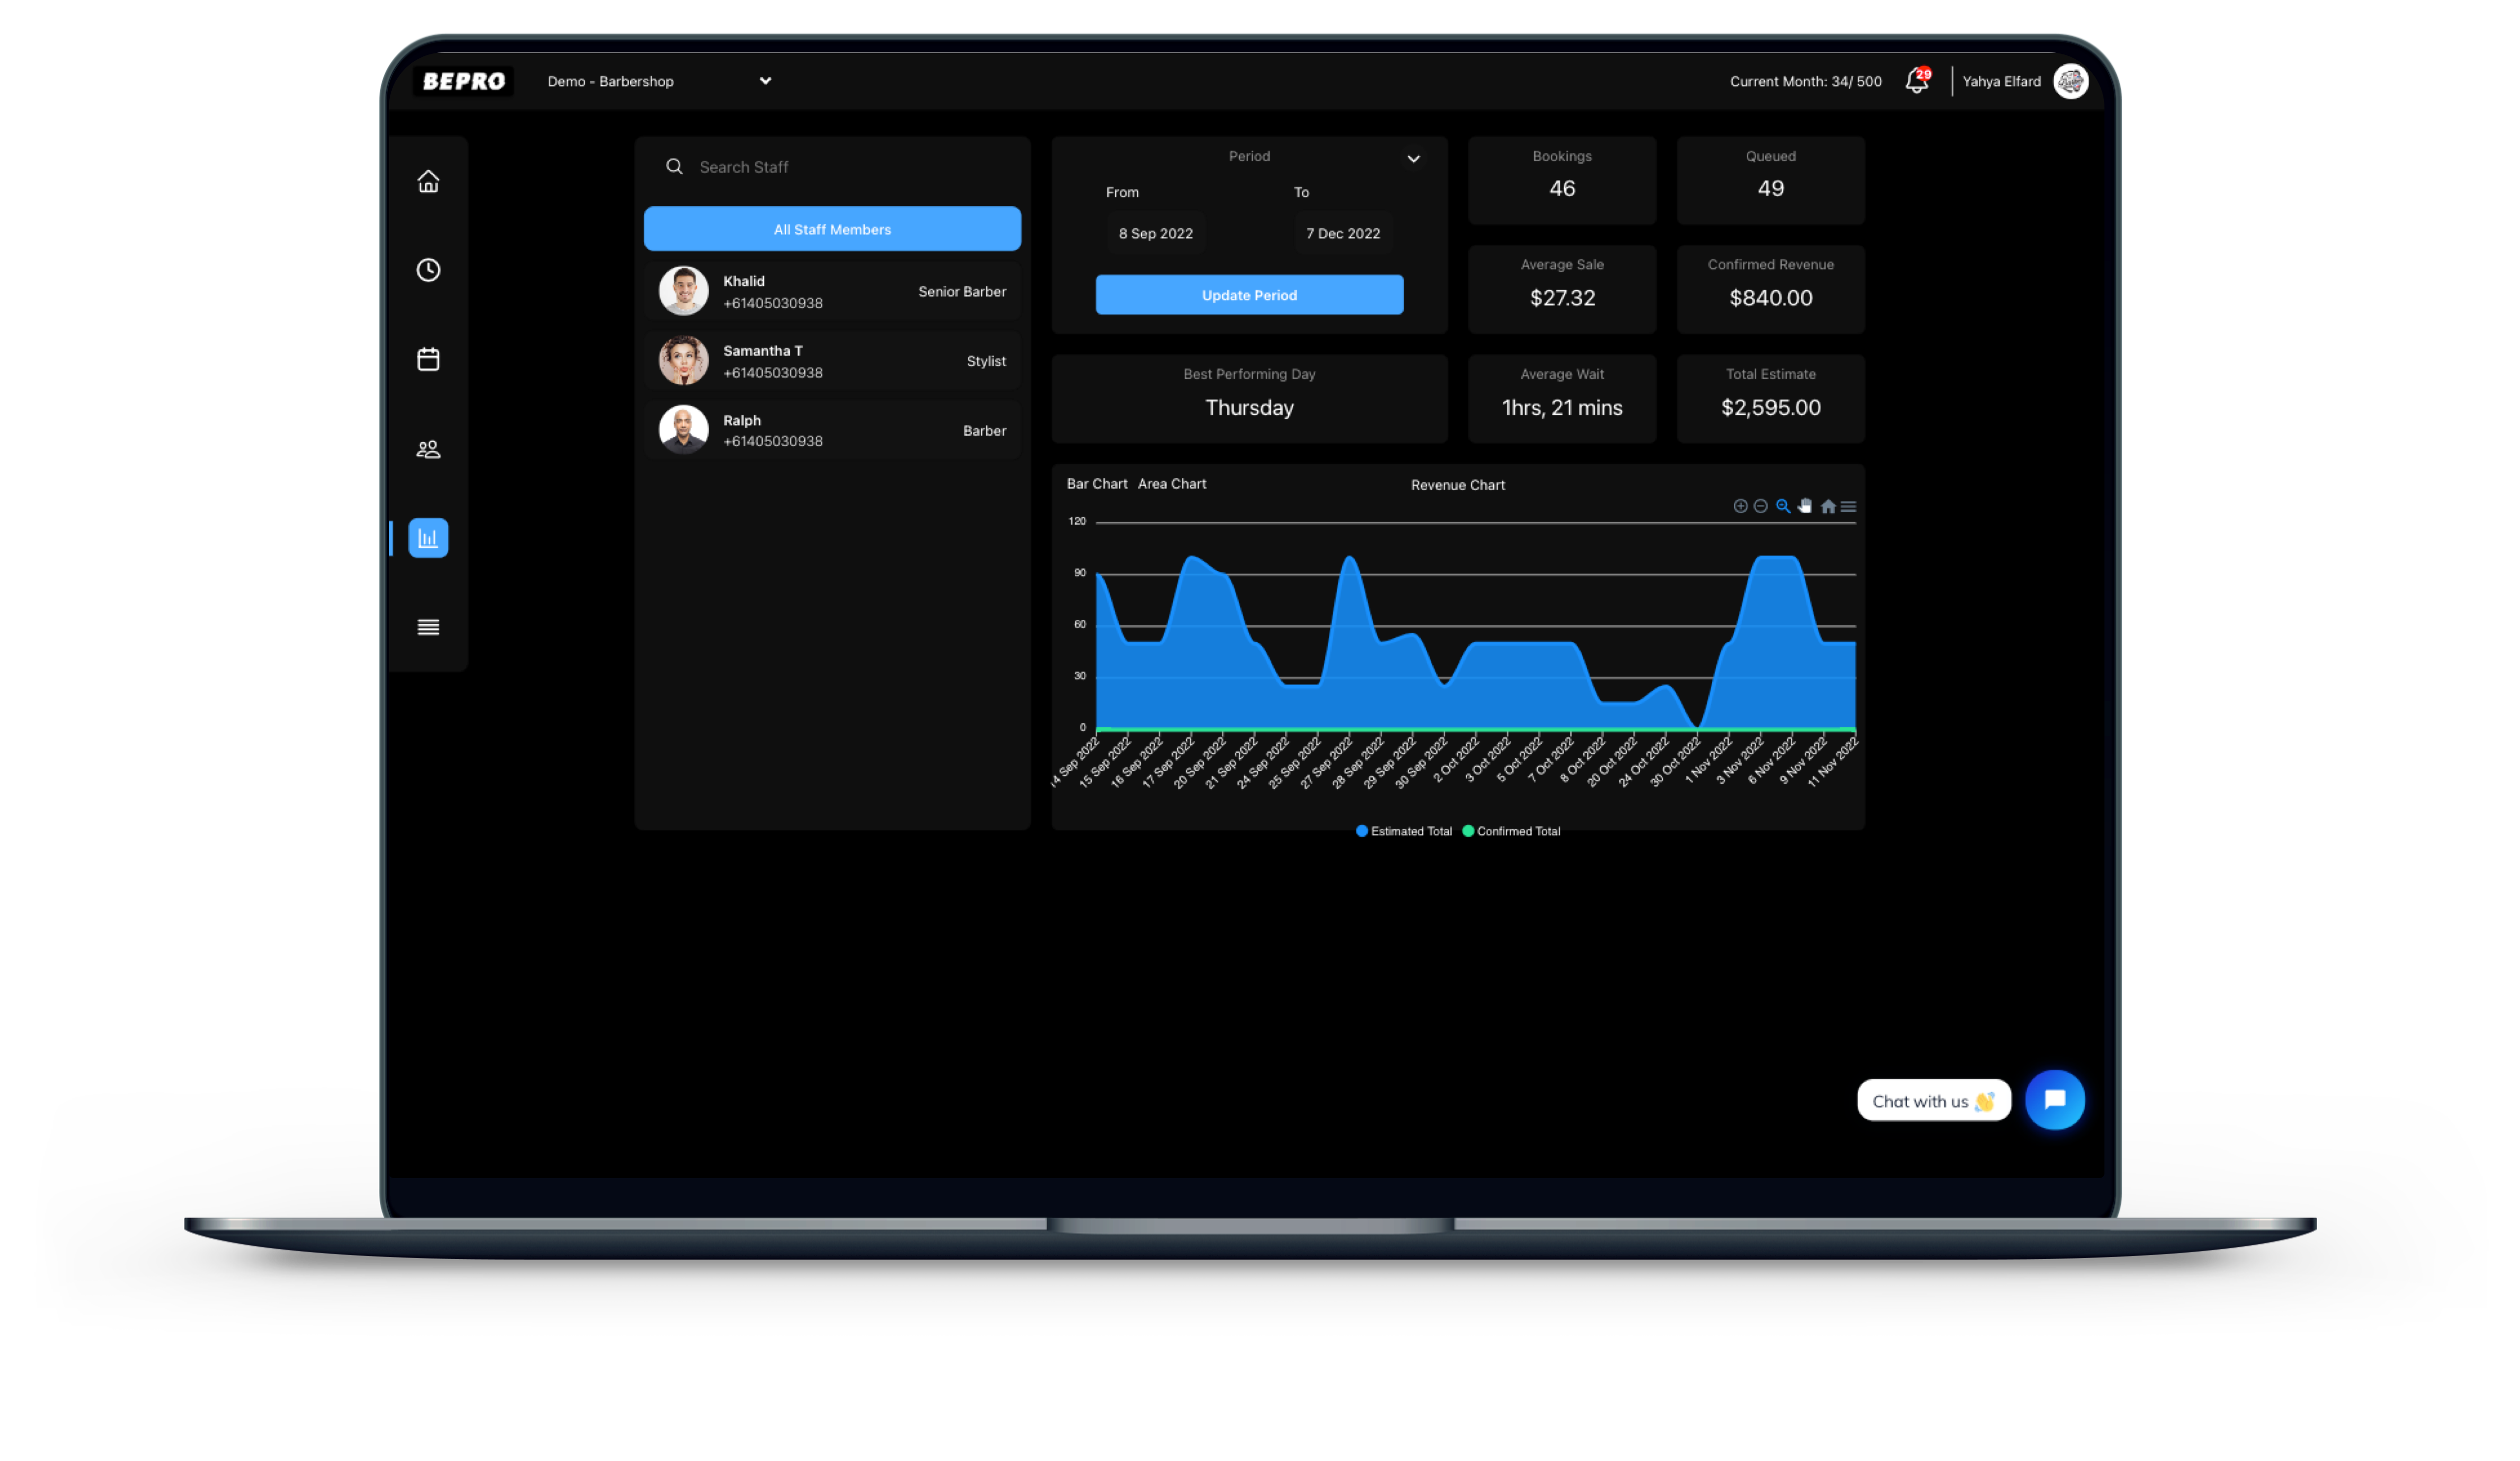
In addition to all the other useful data, Bepro's analytical gauges you have Charts and Graphs in your arsenal. This data can help visually show performance throughout the year, month or week, to better understand customer behaviour and patterns. Additionally graphs and charts can saved & downloaded.
